
We continue a series of publications about artifacts that customers receive at the very first stage of development — the discovery phase. We have already explained what MindMap, User Stories, BPMN Diagram, Customer Journey Map are and how we use these tools in development.
Today we are talking about the Request response diagram, the optional artifact, we use if the project provides integrations (for example, with Google translator, delivery and logistics service, online payment, etc.).
What is a Request response diagram is and what it looks like
A request-response diagram or sequence diagram is a type of interaction diagram. It usually contains objects that interact within the script, the messages they exchange, and the returned results associated with the messages.
Sequence diagrams are used to describe the logic of use cases in more detail.
The request-response diagram reflects:
- exchange of messages between objects (including in the framework of messaging with third-party Systems);
- restrictions imposed on the interaction of objects;
- events that initiate object interactions.
Unlike the BPMN diagram, which shows the algorithm of the system, the Request response diagram draws the attention of developers to the messages that objects exchange with each other.
Everything will become clear now
Let's look at a simple example of how the Request response diagram works to visualize how this artifact works.
This chart shows the service in the restaurant:
Fred (the customer) orders food to Bob (the waiter), Bob passes the order to Hank (the cook). While the cook prepares the food, the waiter pours wine to the client. Hank gives the order to Bob, Bob serves the dishes. Fred eats and then pays for dinner through the cashier Renne.
This is a simple diagram, in web and mobile development, such diagrams show more complex processes and integrations. But such a tool gives an understanding of the logic of the process since we see how objects should work throughout the entire time cycle.
Request response diagram is a rather complex notation that has its own language. To read it correctly, you need to know the meaning of each character. We will not dwell on the decoding now, since studio clients usually do not have to deal with the diagram, this artifact rather optimizes the work in the development team.
How and why we use the Request response diagram in the development
Request response diagram is most often used during the discovery phase when the service has integration.
When there is integration, there is a need to prescribe the logic with this integration.
This logic is not only to show the requests and responses of the system itself but also to save the client's money if the integration is paid.
Business or system analysts in a company with a project manager develop a business model that will allow for productive and economical integration.
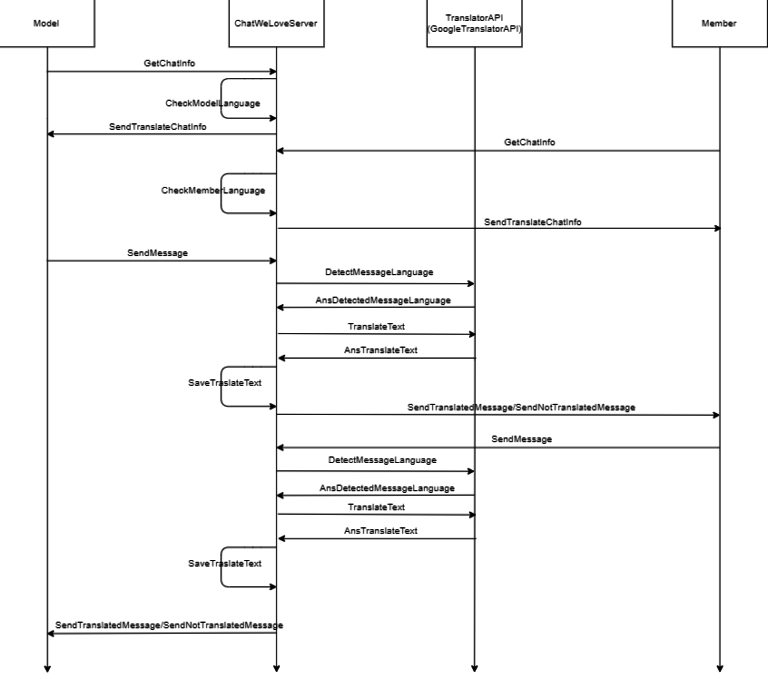
Using the example of integration with Google translator (in the diagram below), it can be seen that this diagram shows how to save all previously translated texts to the system to use them in the future. Thus, you will not have to contact a paid translator every time and spend the client's money.
After the discovery phase, having a well-developed integration, the developer understands how it should work. In this case, he can give an estimate of the time and, accordingly, the cost of development.
Getting started, the developer spends much less time implementing the integration. The client receives the result of integration with the system in a shorter time.
Therefore, we always recommend making a diagram at the discovery stage (but only when the project needs it). However, the decision is always left to the customer.
Have a project or ideas? Let's discuss them! We are ready to consult and calculate the development budget for free. Leave a request and we will contact you!