


What is a KPI in software development?
A KPI in software development is a key performance indicator — a measurable value tied to an outcome that shows how effectively a team ships working software. The KPIs that matter in 2026 balance four things: delivery speed, stability, quality and developer experience. The widely used core is the four DORA metrics, best paired with the SPACE framework and a developer-experience score, tracked as team-level trends rather than scores used to rank individuals.
A KPI in software development is a key performance indicator: a measurable value, tied to a goal someone actually cares about, that tells you how well a team is delivering working software. The head term people search — KPIs for software development — covers this whole practice of turning delivery into numbers you can steer by. The word "key" is doing real work: a metric becomes a KPI only when it is linked to an outcome and someone changes a decision based on it. Everything else is just a number.
The distinction that trips teams up is metric versus KPI. Lines of code, commits and hours logged are metrics — they measure activity. Deployment frequency, change-failure rate and developer satisfaction are KPIs — they measure whether you are shipping value reliably and sustainably. Measuring the wrong thing is worse than measuring nothing, because people optimise for whatever you count. That is exactly why a good product engineering partner agrees the KPIs before the first sprint: the metrics you choose quietly shape how the team behaves, so someone has to own that choice deliberately rather than default to whatever a tool reports.
These key performance indicators for software development are read as trends, not snapshots. A single week's deployment frequency tells you almost nothing; the direction over a quarter tells you whether a change to how you work is helping or hurting. Throughout this guide, treat every KPI the same way — as a conversation starter about a trend, tracked at the team level, never as a leaderboard.
Why software development KPIs matter
Software development KPIs matter because, without them, delivery is run on anecdote and gut feel — and the two most expensive mistakes both come from not measuring. The first is mistaking activity for progress: a team that looks busy, ships often and closes tickets can still be slowing down, accumulating defects and burning out. The second is the opposite blind spot: cutting corners for speed without seeing the quality debt pile up until it stalls the whole roadmap.
Good KPIs make those trade-offs visible. Research from the DORA program and others has repeatedly shown that high-performing teams are not the ones that simply move fastest — they are the ones that move fast and keep failure rates low, because they treat speed and stability as a pair. That is the core reason to measure: a balanced KPI set forces the conversation about the trade-off you are actually making, instead of letting it happen by accident. If you want the wider delivery picture around these metrics, our guide to software development project management covers how KPIs fit into planning, scope and reporting.
There is a 2026-specific reason this matters more than it used to. AI coding assistants now generate a large share of committed code on many teams, which inflates raw output — more commits, more pull requests, higher deployment frequency — without any guarantee that quality kept up. Speed metrics can flatter a team that is actually generating rework. In that environment, KPIs are how you tell real acceleration from a mirage, and why every serious framework in 2026 pairs a speed measure with a quality and an experience measure.
The four categories of software development KPIs
Software development KPIs sort cleanly into four categories, and a healthy set draws from all four rather than piling up in one. Choosing across categories is what makes a KPI set balanced — pick only speed metrics and you will optimise for shipping fast at the cost of everything else.

- Delivery & speed. How quickly you turn an idea into running software — deployment frequency, lead time for changes and cycle time. These answer "are we fast?"
- Stability & quality. Whether that speed is safe — change-failure rate, failed-deployment recovery time, defect escape rate and test coverage. These answer "are we breaking things?"
- Flow & productivity. How smoothly work moves through the team — throughput, work-in-progress, sprint predictability and pull-request cycle time. These answer "is the system healthy?"
- Experience & value. Whether developers can do their best work and whether it lands — developer satisfaction (DevEx), plus outcome measures like feature adoption and time to value. These answer "is it worth it?"
The four categories are also why no single number can summarise a team. Speed without stability is recklessness; stability without flow is bureaucracy; flow without value is efficient waste. Keep at least one KPI live in each category and the set stays honest, because a gain in one place that quietly costs you another has nowhere to hide.
15 software development KPI examples for 2026
The best software development KPI examples span the four categories, and the fifteen below are the metrics most teams draw from in 2026. You do not track all fifteen — you pick a balanced handful (see how to choose below). Each one is defined so it stands on its own, because a KPI no one can define consistently gets gamed.

| KPI | Category | What it measures | How it's calculated |
|---|---|---|---|
| Deployment frequency | Delivery | How often you release to production (DORA); elite teams deploy on demand, often many times a day | Production deploys ÷ time period |
| Lead time for changes | Delivery | Time from code commit to running in production (DORA); short lead time means fast feedback | Deploy timestamp − first commit timestamp |
| Cycle time | Delivery | Time to complete one work item from start to done, including waiting — where most delay hides | "Done" timestamp − "in progress" timestamp |
| Change-failure rate | Stability | Share of deployments that cause a failure needing a fix (DORA); the speed counterweight | Failed deployments ÷ total deployments × 100 |
| Failed-deployment recovery time | Stability | How fast you restore service after a bad release (DORA, formerly MTTR) | Service-restored timestamp − incident-start timestamp |
| Defect escape rate | Quality | Bugs that reach production versus those caught earlier — the true cost of moving fast | Production defects ÷ total defects found (pre- + post-release) × 100 |
| Test coverage | Quality | Share of code exercised by automated tests; useful as a floor, misleading as a target | Lines/branches covered by tests ÷ total lines/branches × 100 |
| Escaped-defect resolution time | Quality | How quickly production bugs are fixed once found — responsiveness to real users | Fix-deployed timestamp − bug-reported timestamp |
| Throughput | Flow | Work items completed per period; a capacity signal, not a productivity score | Items marked done ÷ time period |
| Sprint predictability | Flow | How consistently the team delivers what it committed to — trust in the plan | Points/items delivered ÷ points/items committed × 100 |
| Work-in-progress (WIP) | Flow | How much is started but unfinished; high WIP is the usual cause of slow cycle time | Count of items in an active (non-done, non-backlog) status |
| Pull-request cycle time | Flow | Time from PR opened to merged; long review queues stall otherwise-fast teams | PR-merged timestamp − PR-opened timestamp |
| Rework rate | Quality | Code changed again soon after merging; the metric that catches AI-inflated speed in 2026 | Lines/commits reverted or rewritten within ~21 days ÷ lines/commits shipped × 100 |
| Developer experience (DevEx) | Experience | Survey-based measure of friction, focus time and satisfaction; explains the other numbers | Periodic survey score (for example eNPS or a 1–5 satisfaction scale) |
| Feature adoption / time to value | Value | Whether shipped work is actually used and how fast it delivers benefit — the point of it all | Active users of a feature ÷ users who could use it; first-value timestamp − release timestamp |
Notice that the first five are the DORA and flow classics, the middle band is quality, and the last two are the ones teams most often skip — rework and value. Skipping them is exactly how a team ships more and delivers less. If your work runs across many squads and systems, these same metrics scale up into governance dashboards for an enterprise software development programme, where the failure mode is measuring locally while the whole system slows.
DORA vs SPACE vs DevEx: which framework should you use?
The honest answer is that you use them together, because each framework answers a different question and none is complete alone. DORA measures whether your delivery pipeline is fast and stable; SPACE measures whether your developers are productive, satisfied and healthy; DevEx explains the friction that connects the two. In 2026 the leading teams combine them, and newer unifying frameworks like DX Core 4 explicitly fold DORA, SPACE and DevEx into a single scorecard of speed, effectiveness, quality and impact.
| Framework | What it measures | Best used for |
|---|---|---|
| DORA | Delivery performance: deployment frequency, lead time, change-failure rate, recovery time | The core delivery scorecard every team should start with |
| SPACE | Five dimensions: Satisfaction, Performance, Activity, Communication, Efficiency/flow | Seeing productivity as human and multi-dimensional, not one number |
| DevEx | Developer experience: friction, flow state, cognitive load and feedback loops | Explaining why the DORA and SPACE numbers look the way they do |
| DX Core 4 | Unifies the above into speed, effectiveness, quality and business impact | Teams that want a single 2026 executive scorecard across frameworks |
A practical way to sequence them: start with DORA because it is objective and automatable, add a DevEx survey once the delivery numbers raise questions you cannot answer with pipeline data, and reach for the full SPACE or DX Core 4 view when leadership needs a rounded picture rather than a speed reading. The frameworks are lenses on the same team — the mistake is treating any one of them as the whole truth.
DORA benchmarks: elite vs low performers
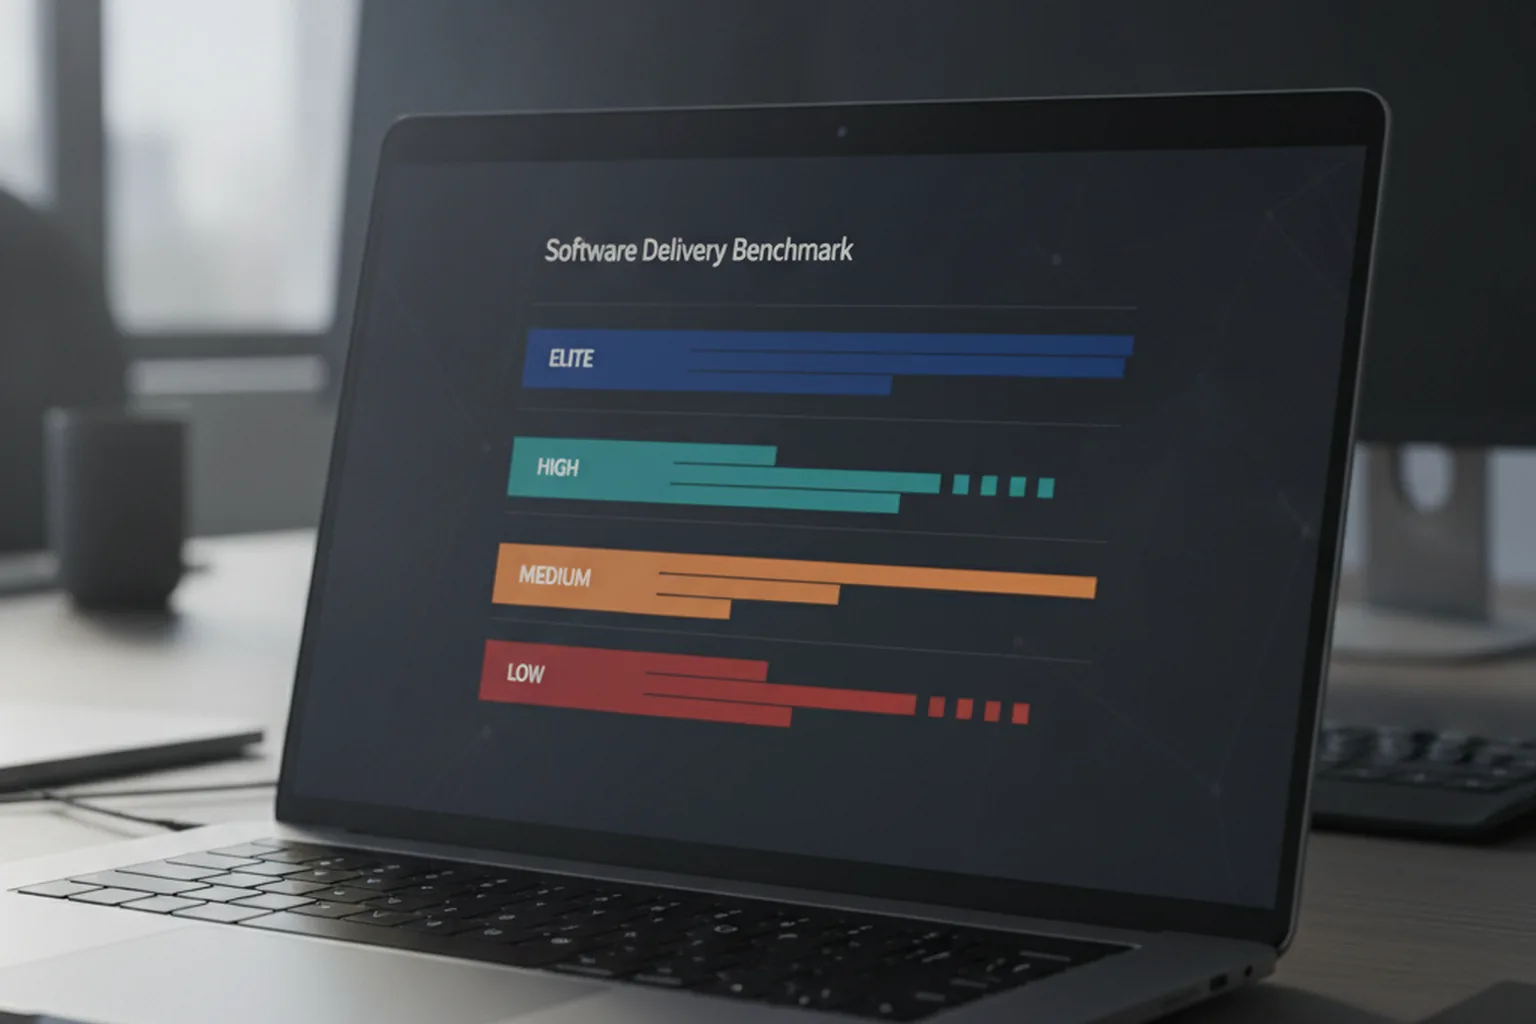
Numbers alone do not tell you if a team is fast — you need a reference range to know whether a given lead time or change-failure rate is good, average or a warning sign. The DORA research program has tracked four performance tiers across thousands of teams for years, and the pattern has stayed remarkably stable: elite performers are not just faster, they are also more stable, which is the whole point of pairing a speed metric with a stability metric.
| Performance tier | Deployment frequency | Lead time for changes | Change-failure rate | Recovery time |
|---|---|---|---|---|
| Elite | On demand, multiple times a day | Less than one day | 0–15% | Less than one hour |
| High | Between once a week and once a month | One day to one week | 16–30% | Less than one day |
| Medium | Between once a month and once every six months | One month to six months | 16–30% | One day to one week |
| Low | Fewer than once every six months | More than six months | Over 30% | More than six months |
Read these as directional bands, not a scoreboard to hit exactly — the DORA program itself reports ranges that shift slightly year to year, and your own baseline matters more than where you sit relative to a stranger's team. What the table is useful for is a gut check: if deployment frequency looks "high" but change-failure rate sits in the "low" column, that gap is the signal to act on, not the deployment number alone. Most teams find it faster to move one tier at a time — going from monthly to weekly deploys — than to leap straight to elite, and the stability metrics should improve alongside speed, not lag behind it.
How to build a software development KPI dashboard
A good software development KPI dashboard shows a small, balanced set of metrics as trends, grouped by theme, with each one owned by the team rather than by management. The goal is a shared instrument the team reads together, not a surveillance panel someone checks to grade people. Build it in five steps.
- Pick five to eight KPIs tied to a goal. One or two per category from the table above. If you cannot say which decision a metric informs, leave it off the dashboard.
- Automate collection. Pull data straight from your CI/CD, issue tracker and incident tools so no one types numbers by hand. Manual metrics rot and invite fudging.
- Show trends, not snapshots. Every KPI as a line over time with a clear direction. A single-week figure is noise; the slope is the signal.
- Set target ranges, not maximise-forever goals. "Deploy on demand with change-failure under 15%" beats "deploy as often as possible" — the second guarantees someone games it.
- Review as a team on a cadence. Walk the dashboard in the retrospective, ask what a trend is telling you, and change one thing. A dashboard no one discusses is wallpaper.
You do not need to build the plumbing yourself. In 2026, engineering-intelligence platforms such as Jellyfish, LinearB, Cortex and Hivel ingest signals from CI, issue tracking and incident tools automatically and render DORA and flow metrics out of the box, and many teams pair one with their existing board rather than wiring dashboards from scratch. Whatever you use, the tool is the easy part — the discipline of a small, owned, regularly-discussed set is what makes a dashboard change behaviour.
KPIs for a software development team
KPIs for a software development team should always be measured at the team level, never used to rank individuals — that single rule prevents most of the damage metrics can do. The moment a KPI is used to compare developers, people optimise their personal number instead of the shared outcome: they inflate commits, avoid hard tickets and stop helping teammates because helping does not show up on their scorecard.
A practical starter set for a team is the four DORA metrics plus sprint predictability, defect escape rate and a developer-experience score — seven KPIs covering all four categories. That set answers the questions a delivery lead actually has: are we shipping (deployment frequency, lead time), safely (change-failure rate, recovery time), predictably (sprint predictability), without leaking defects (escape rate), and is the team able to do good work (DevEx). How those roles and responsibilities are arranged shapes what you can measure, which is why our guide to software development team structure pairs naturally with this one.
Velocity deserves a special warning here. Sprint velocity — story points completed per sprint — is useful for a team to forecast its own capacity, but it is meaningless as a productivity or comparison metric: points are relative to each team's estimation, so comparing velocities across teams or pushing a team to "raise velocity" simply inflates estimates. Use velocity to plan, never to judge, and keep it inside the team where it belongs. For how velocity fits sprint planning specifically, see our agile software development guide.
Which KPIs should you avoid?
Avoid any KPI that measures activity instead of outcomes, and avoid using good KPIs in the ways that corrupt them. The classic vanity metrics look productive and tell you almost nothing about value delivered — worse, they actively mislead once people know they are counted.
- Lines of code. More code is a cost, not an achievement. Rewarding it produces bloated, harder-to-maintain software — the opposite of good engineering.
- Commit or PR count. Easy to inflate by splitting work into trivial pieces; measures busyness, not progress. AI assistants make this number especially hollow in 2026.
- Hours worked. Time in the seat is input, not output, and rewarding it drives burnout and presenteeism rather than results.
- Individual velocity. Story points per developer weaponises a planning tool and destroys the shared ownership that healthy teams run on.
- Any single metric in isolation. Even DORA metrics mislead alone — high deployment frequency with a hidden change-failure spike is a problem dressed as a win.
Behind all of these sits Goodhart's law: when a measure becomes a target, it stops being a good measure. The defence is the same balanced, team-level, outcome-focused approach this guide has argued for throughout — track a small set across all four categories, read them as trends, and keep them out of individual performance reviews.
How to choose the right KPIs for your team
Choose the smallest set of KPIs that keeps speed, stability, quality and developer experience all visible at once — for most teams that is five to eight metrics, not a wall of thirty. The point of choosing well is that attention is finite: every KPI you add dilutes focus on the rest and adds one more thing to game, so the discipline is subtraction, not addition.
- Start from a goal. "Ship faster without more incidents" or "cut lead time this quarter" — the goal decides which metrics are relevant.
- Cover all four categories. At least one KPI each from delivery, stability, quality and experience so no trade-off is invisible.
- Prefer automatable, objective metrics. DORA and flow metrics come from tools you already run; survey metrics like DevEx add the human layer machines cannot see.
- Pair every speed metric with a counterweight. Deployment frequency next to change-failure rate; throughput next to rework rate. Never a speed KPI alone.
- Apply the decision test. For each candidate, name the decision it would change. If you cannot, drop it — it is a metric, not a KPI.
Then revisit the set every quarter. As the goal shifts, the right KPIs shift with it; a dashboard frozen in place slowly measures a team that no longer exists. Choosing KPIs is not a one-time setup — it is a standing habit of keeping the numbers pointed at what matters now.
FAQ
What is a KPI in software development?
A KPI in software development is a key performance indicator — a measurable value that shows how effectively a team is delivering working software against a goal. Unlike a raw metric, a KPI is tied to an outcome someone cares about, such as delivery speed, stability, quality or developer experience. Good software development KPIs track results (did we ship value reliably) rather than activity (how many hours or lines of code), and they are read as trends over time, not as single-point scores or a way to rank individuals.
What are good software development KPI examples?
Good software development KPI examples fall into four groups. Delivery and speed: deployment frequency, lead time for changes and cycle time. Stability and quality: change-failure rate, failed-deployment recovery time (MTTR), defect escape rate and test coverage. Flow and productivity: throughput, work-in-progress, sprint predictability and pull-request cycle time. Experience and value: developer satisfaction (DevEx), plus outcome measures like feature adoption and time to value. The four DORA metrics — deployment frequency, lead time, change-failure rate and recovery time — are the widely used core in 2026, best paired with a quality and a developer-experience measure.
What KPIs should a software development team track?
A software development team should track a small balanced set — usually five to eight KPIs — that covers speed, stability, quality and developer experience, and it should track them at the team level, never to rank individuals. A practical starter set is the four DORA metrics (deployment frequency, lead time for changes, change-failure rate and failed-deployment recovery time) plus sprint predictability, defect escape rate and a developer-experience score. Balance is the point: speed metrics alone reward shipping fast at the cost of quality, so every speed KPI needs a stability or quality KPI beside it.
What should a software development KPI dashboard include?
A software development KPI dashboard should show a small set of balanced metrics as trends, grouped by theme — delivery, stability, quality and experience — with each metric owned by the team, not by management. Build it in five steps: pick five to eight KPIs tied to a goal, automate collection from your CI, issue tracker and incident tools so no one enters numbers by hand, show trends rather than single points, set target ranges instead of maximise-forever targets, and review it as a team on a regular cadence. Tools like Jellyfish, LinearB, Cortex and Hivel ingest signals automatically and are common dashboard choices in 2026.
Are DORA metrics enough on their own?
No — DORA metrics are the best-known delivery KPIs but they are not enough on their own, because they measure pipeline speed and stability, not whether developers are productive, satisfied or building the right thing. In 2026 most teams pair DORA with the SPACE framework (which covers satisfaction, performance, activity, communication and efficiency) and a DevEx or developer-experience score. This matters more now that AI writes a large share of code: deployment frequency can rise while rework and defects hide the real cost, so DORA needs a quality and an experience metric beside it.
How many software development KPIs should you track?
You should track a small number of software development KPIs — roughly five to eight — chosen to cover speed, stability, quality and developer experience without overlap. Tracking too many dilutes attention and invites gaming; tracking too few hides trade-offs, such as speed bought at the cost of quality. The test for keeping a KPI is simple: if no one changes a decision because of it, it is decoration, not a KPI. Start with the four DORA metrics, add one quality and one experience measure, and only expand when a specific question demands it.
Last updated 25 September 2026. Framework details (DORA, SPACE, DevEx, DX Core 4), the DORA performance-tier ranges and other performance patterns reflect widely reported 2026 industry sources and should be read as directional guidance, not exact targets. The right KPI set depends on your team's goals, size and delivery model.